Understanding Energy Monitoring
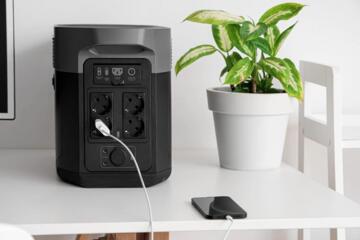
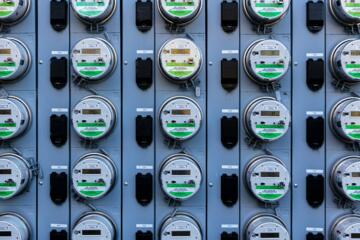
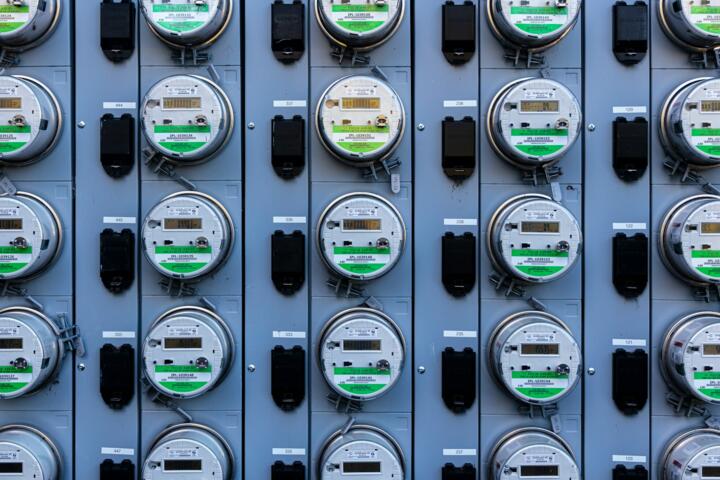
Energy monitoring means capturing your electricity use data as it happens, not just at month's end. With smart meters and sensor-based tools installed in circuits or devices, you get minute-by-minute updates on power consumption. For example, a typical U.S. household uses about 900 kWh per month, but without monitoring, pinpointing which appliance drives spikes remains guesswork. Smart energy monitors show this live, sometimes down to individual devices.
Imagine a fridge humming louder than usual - the monitor instantly flags unusual consumption. Tools like Sense or Emporia Vue upload this data to a phone or desktop app, displaying current and historical stats clearly. Some models (Rev 2.4 in 2023) achieve high accuracy, detecting loads as small as 5 watts, revealing phantom energy drains.
Knowing your consumption down to the minute reveals patterns and potential savings. This technology breaks the barrier between paying bills and understanding what causes them.
Key Challenges of Monitoring
People often start energy monitoring expecting immediate savings but get overwhelmed by data volume or device pairing issues. A common error is assuming all monitors provide the same data quality or intervals. Many commercial-grade devices update every minute or less, but lower-end ones can lag by 15 minutes, diluting actionability.
Users also underestimate the variability in household loads. For example, laundry machines spike usage but only once or twice a week. Without context, users misinterpret spikes as costly even if their impact is minimal over a month. Incorrect setup can skew results too; one friend installed a sensor backwards, showing negative values, which, frankly, most people skip troubleshooting and discard data.
Misunderstanding leads to ignoring monitoring results altogether. But ignoring fluctuating energy data can mean ongoing waste, with bills inflated by unnoticed standby power or faulty appliances.
Practical Energy Tracking
Device-Level Monitoring
Attach clamps or smart plugs to specific appliances. It isolates energy use for that device instead of whole-house numbers. This works well on major consumers like HVAC units, water heaters, or electric ovens. Tools like TP-Link Kasa smart plugs supply live data plus control features, so you can remotely power off forgotten devices. A monitored HVAC system could reveal 25% more consumption than expected due to leaks or inefficient cycling.
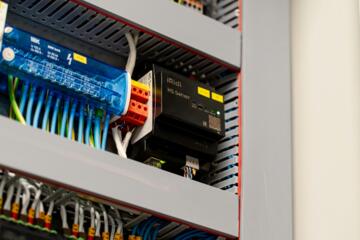
Whole-House Monitors
Installed at the circuit breaker box, these capture all electricity flow entering the home. Brands like Sense employ machine learning algorithms to detect individual devices by signature, though it takes weeks of learning. These systems offer detailed charts and alerts through apps, ready for iOS or Android. Some users report finding energy vampires causing 20–30% of phantom loads.
Cloud and Mobile Apps
Many monitors send data to cloud platforms, aggregating it, enabling extensive analysis and comparisons. Apps from Emporia, Curb, or Neurio provide custom graphs, cost estimates based on local tariffs, and monthly trends. Data exports in CSV or API endpoints make further DIY analysis possible. Data protected under GDPR or CCPA regulations is standard for reputable services.
Integration with Smart Home Systems
Monitoring combined with home automation triggers actions. For example, if air conditioning usage spikes unexpectedly, smart thermostats like Ecobee can adjust setpoints automatically. Even IFTTT scripts link energy conditions to automated alerts or device shutdowns. This automation, however, needs tuning to avoid nuisance shutdowns or false alarms.
Time-of-Use (TOU) Analysis
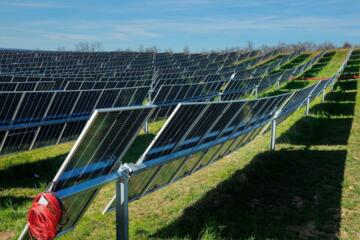
Energy monitors help take advantage of TOU pricing by showing period-specific consumption on utility rates that vary hourly. In California, peak rates can be 3–4 times higher than off-peak. Monitoring allows shifting heavy energy use to cheaper times, saving up to 15% monthly without behavioral changes—just smarter scheduling.
Data Visualization Techniques
Besides raw numbers, effective monitors present usage in intuitive formats: heatmaps, bar graphs, and trend lines. This makes spotting anomalies and habits easier. Visually, trends jump out better than tables. One visualization tool I experimented with recently (third-party open source version 1.5.2) helped me catch a leaking pool pump causing a constant 30-watt draw.
Alerts and Notifications
Set thresholds for unusual spikes or continuous high use. Alerts then send emails or push notifications. Early warnings on appliance failure or runaway consumption reduce waste before the monthly bill arrives. Many apps allow setting flexible rules, but watch for alert fatigue, which reduces their effectiveness.
Battery-Backed and Offline Options
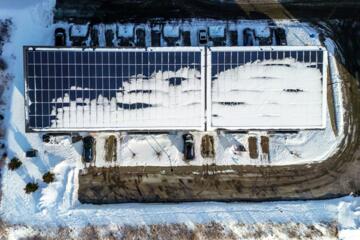
Some areas face network outages affecting real-time data flow. Devices with onboard storage log data locally when offline, uploading it later. This keeps consumption tracking consistent. For remote locations, standalone monitors with LCD displays offer basic real-time info without relying on Wi-Fi.
Energy Audits Based on Data
Use monitor insights to guide professional energy audits. When you know peak use and anomalies, auditors focus inspections efficiently, which saves time and money. The data-driven approach uncovers insulation failures, inefficient appliances, or wiring problems that standard audits might miss.
Example Use Cases
A mid-sized office with 50 employees faced unusually high utility bills—about 35% over projections compared to previous years. They installed a whole-building smart monitor in late 2022. The device uncovered that after-hours HVAC cycling consumed 12% of total monthly energy. Adjusting schedules and sealing ducts cut bills by 18% within three months.
In another case, a family of four tracked individual appliances using smart plugs after noticing spiking March bills. They found an electric water heater causing a 40% higher draw than the rated 4500-Watt specification due to thermostat malfunction. Replacing it with a new unit cut monthly heating costs by $22 approximately.
Features to Compare
| Feature | Whole-House | Plug Monitoring | Smart App |
|---|---|---|---|
| Installation | Breaker Box | Plug Socket | None |
| Data Detail | All Devices | Single Device | Aggregated |
| Real-Time Update | 1-5 sec | Instant | Depends on Source |
| Cost Range | $250–500 | $20–50 per unit | Free–$100 |
| Learning Curve | Medium | Low | Variable |
Typical Errors
Many users rush to buy without verifying compatibility—older homes need breakers compatible with sensor clamps, and not all smart plugs handle high loads safely. Poor installation can show false readings or no data at all.
Ignoring baseline calibration skews interpretations. A baseline measure with all devices off sets a reference to detect phantom loads. Skipping it leaves unknowns.
Overlooking firmware updates is common — monitor devices' software manages data accuracy and security; ignoring updates may cause glitches or data loss.
Finally, relying solely on consumption numbers, without cross-checking against outside factors like weather or occupancy, leads to wasted troubleshooting. Energy use reflects many variables.
FAQ
What types of energy monitors exist?
There are whole-house monitors that clamp onto the electrical panel, device-specific smart plugs, and hybrid systems combining both approaches. Each offers different granularity and installation complexity.
Can I install energy monitors myself?
Smart plugs are usually plug-and-play. Whole-house devices often require handling live wires in the breaker panel. For safety, certified electricians should install them unless you have electrical skills.
How precise are these monitors?
Accuracy varies. Good whole-house monitors detect down to 5 watts with 1–2% error. Plug-level monitors may read slightly higher errors but suffice for home use.
Does monitoring reduce energy bills automatically?
No, data only informs you. Savings come from changing habits based on insights and addressing inefficiencies revealed by the monitor.
Are there privacy concerns?
Data about your home's energy use can reveal lifestyle patterns. Choose services with strong privacy policies and local data storage options to minimize risk.
Author's Insight
I’ve installed three different whole-house and device-level monitors across multiple homes since 2019. The key is patience—these tools need time to build meaningful data profiles. The single device pickup, especially with machine learning, works but often surprises with false positives initially. My advice? Keep monitoring for at least 2 months before drawing conclusions. Alerts are useful but tweak them; otherwise, you will ignore them fast. Data-driven savings aren’t magic; they come from steady adjustments.
Summary
Smart energy monitoring equips you with visibility into electricity usage down to individual devices or total home loads in real time. Avoid common setup errors, pick devices matching your home and goals, and interpret data with context. Use insights to reduce waste and optimize consumption patterns, leading to noticeable savings on bills and equipment longevity. Start small, track consistently, and refine your approach as you learn more from the data.